Main window
The main window is the core part of the emuStudio application. Users usually spend there most of the time while working with emuStudio.
The content of the window is split into two panels or tabs, placeholders for two actions users can do in emuStudio. The first tab is “Source code editor”, second is “Emulator”, used during computer emulation.
Source code editor
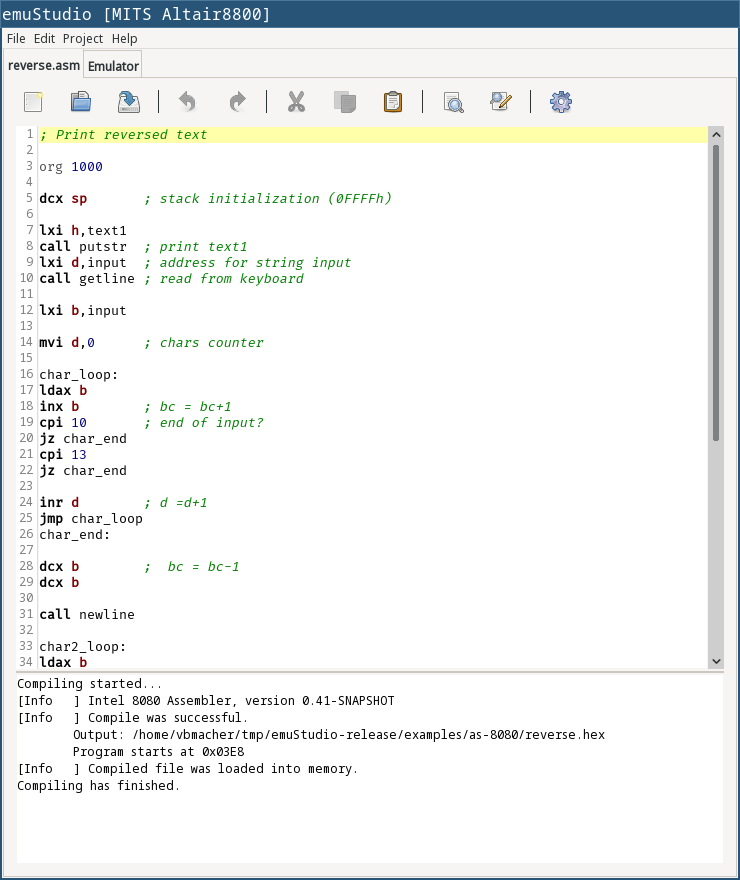
In the source code editor, users can write programs for the emulated computer. However, the most important tool which allows translation of the source code into a binary program readable by emulated CPU is a compiler. Therefore, users must use the right compiler.
The input language of a compiler is not limited, it can be either a kind of assembler or even C or Pascal language. It depends on the compiler implementation, there can be many. The only restriction is that compiler must have an output that is compatible with CPU which is currently being emulated. This cannot be checked automatically, users must take care of this.
The source code editor supports the following features:
- fixed font: Fira Code regular (cannot be changed at the moment)
- line numbering & syntax highlighting
- undo/redo capability
- search/replace text
- cut/copy/paste text
CTRL+{mouse wheel}changes font size
The compilation must be run manually. The compiler output window shows all messages which compiler produces. The content is dependent on the used compiler, but most likely it will contain compilation success or error messages.
Compiled source code can produce an output binary file (for example a HEX file), and it’s automatically loaded into the operating memory. If the emulation is running, the user must stop it first manually.
If another program is loaded in memory, it is not removed before loading the currently compiled program, but the memory is overwritten at only those locations relevant to the compiled program. All the other content is left unchanged.
Emulator tab
Emulator tab is shown in the following image. It is currently open with MITS Altair8800 computer with Intel 8080 CPU, and several devices:
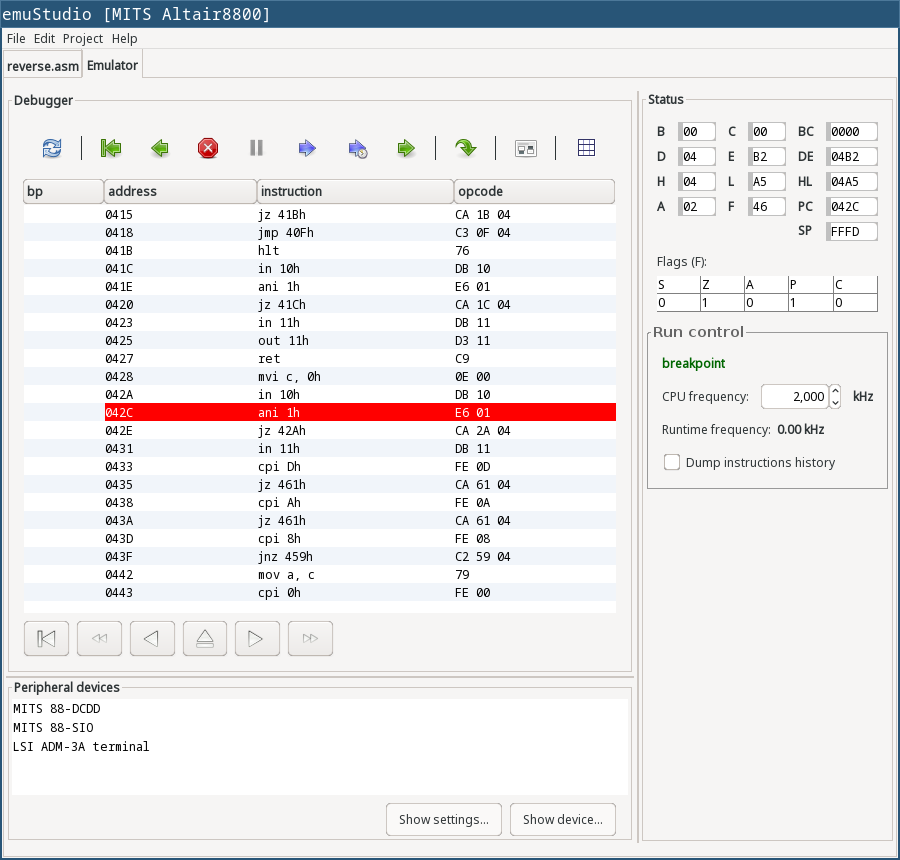
The tab contains three main parts. The first one is very useful - listing of operating memory disassembled into instructions. This part is called a debugger window, or “debugger”. The other part, below the debugger window, is a list of all computer devices used (“peripheral devices”). With a double click, the user can open the GUI window of that particular device, if it supports it.
The right part shows the status of the CPU used in this computer. Each CPU has its own implementation of how the status window look and what it displays.
Debugger window
Debugging is a process in which a programmer tries to analyze a program, usually with the intent to find bugs. The adverb “to debug” has a deep history. Very early computers were having so-called vacuum tubes, which were core elements acting as electrically controlled switches. From time to time a computer stopped working, and the most usual reason was that a bug (a real one) came in a vacuum tube. Maintainers of the computer had to go there and manually remove the bug. It happened that often so that the process of removing bugs got a name - “to de-bug”.] Debugger in emuStudio contains a debugger toolbar and list of few disassembled instructions from memory. In combination with the CPU status panel, it’s the most powerful tool for seeing (and checking) all internal behavior of the emulated computer.
Debugger toolbar
Debugger toolbar contains buttons (icons) for controlling the emulation and accessing memory content. Most of these buttons are self-explanatory. If you hover over those icons, a help text is displayed on how to use the icon.
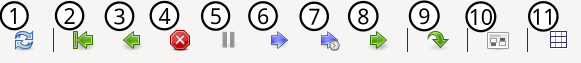
| 1 | Reset emulation. |
| 2 | Set the next instruction position to 0. CPU will perform the next instruction from there. |
| 3 | Set the next instruction position to the (current - 1). This action can completely change the displaying of instructions since the new instruction position does not have to be correct in terms of executing the current program. |
| 4 | Stop emulation (which was either running or paused). |
| 5 | Pause emulation (which was running). |
| 6 | Run emulation (which was paused). |
| 7 | Run emulation with a timer (which was paused). Instructions are executed after elapsing specified time interval. A dialog will appear to enter the time interval. |
| 8 | Step emulation (which was paused). CPU will execute only one - the very next - instruction. |
| 9 | Jump to location. The user will manually specify a location (address in memory) for the next instruction to execute. |
| 10 | Set/unset breakpoint. The user can set or unset a breakpoint on a specific memory location. When the CPU reaches the breakpoint, it will pause there, waiting for the next user action. |
| 11 | Show operating memory. If the memory plugin does not have a GUI, the icon is disabled. |
List of instructions
The largest part of the debugger window a list of few disassembled instructions, so-called instructions window. About 15 instructions are shown, but it depends on the CPU. They are arranged in a table. The first column is usually interactive, allowing the user to set breakpoints. The red strip is pointing to the very next instruction being executed.
The size of disassembled memory (resulting in the number of disassembled instructions) is not configurable. Also, the user cannot change instructions in this place.
Sometimes the instructions shown in the debugger do not have to be disassembled correctly. There are two reasons for that:
- first, instructions can have various binary sizes (e.g. one byte, two bytes, etc.)
- second, memory can contain programs on various locations, and emuStudio doesn’t know where. Well, if it’s just a program compiled from the source code editor, it knows.
The implication is that if emuStudio starts to disassemble instructions at the wrong location, the instructions will be disassembled incorrectly, or they can appear as invalid.
However, emuStudio is trying hard to find the nearest program start location at which it’s safe to start disassembling. Usually, it’s just a few instructions back, so it is a fast process.
Controlling of displaying the instructions
By default, instructions window points to the next instruction with a few instructions before and after the current one. This set of instructions is called an “instructions window”. The instruction window has it’s starting and ending offset in memory. It is possible to move the window to forwards or backward, in a per-page fashion. A toolbar below the instructions list contains controls to control the instruction window pages.

| 1 | Go to the first page. The very first row corresponds to instruction position 0. |
| 2 | Go backward. The user will specify the number of pages for going back. |
| 3 | Go to the previous page. |
| 4 | Go to the page where the current instruction position is. |
| 5 | Go to the next page. |
| 6 | Go forwards. The user will specify the number of pages for going forward. |